Risk, prediction and selection answer different questions
Source:vignettes/risk-and-targets.Rmd
risk-and-targets.RmdThe estimable projection
For a fixed design with more variables than observations, the
coefficient target in the risk calculation is the projection of the
regression vector onto the row space of the supplied design.
hr_risk() computes exact Gaussian coordinate moments and
total squared-error risk for that target, using the supplied design
without automatic centering or standardization.
library(softridge)
set.seed(26)
X <- matrix(rnorm(20 * 30), 20, 30)
beta <- c(1, -1, rep(0, 28))
risk <- hr_risk(X, beta, sigma = 1, k = 2, gamma = 0.05)
c(total_projection_risk = risk$risk,
  sum_coordinate_risks = sum(risk$mse))
## total_projection_risk sum_coordinate_risks
## 0.7678852 0.7678852Fixed-design prediction risk
hr_sure() uses ridge-weighted degrees of freedom for the
fixed-design mean prediction target. The stated unbiasedness requires
fixed tuning and known error variance. A fixed numeric scale is
supported; a response-estimated scale is a different statistical
object.
New covariates and support recovery
Out-of-sample PE evaluates prediction at new covariates. MCC
evaluates recovery of the original coefficient support. Neither is
interchangeable with projection coefficient risk. The independent study
records all three targets separately and uses
mltools::mcc() with its native zero-denominator
convention.
Related foundations
- Shao and Deng (2012), estimation in high-dimensional linear models through a projection and hard-thresholded ridge: https://arxiv.org/abs/1206.0847.
- Hagiwara, scaled soft thresholding in orthogonal settings: https://arxiv.org/abs/1601.08002 and https://arxiv.org/abs/2104.09703.
- Zou and Hastie (2005), elastic-net rescaling: https://doi.org/10.1111/j.1467-9868.2005.00503.x.
These are antecedents, not claims that thresholding or scaling was first introduced in this software. The companion manuscript distinguishes its fixed-parameter results from empirical tuning and scaling.
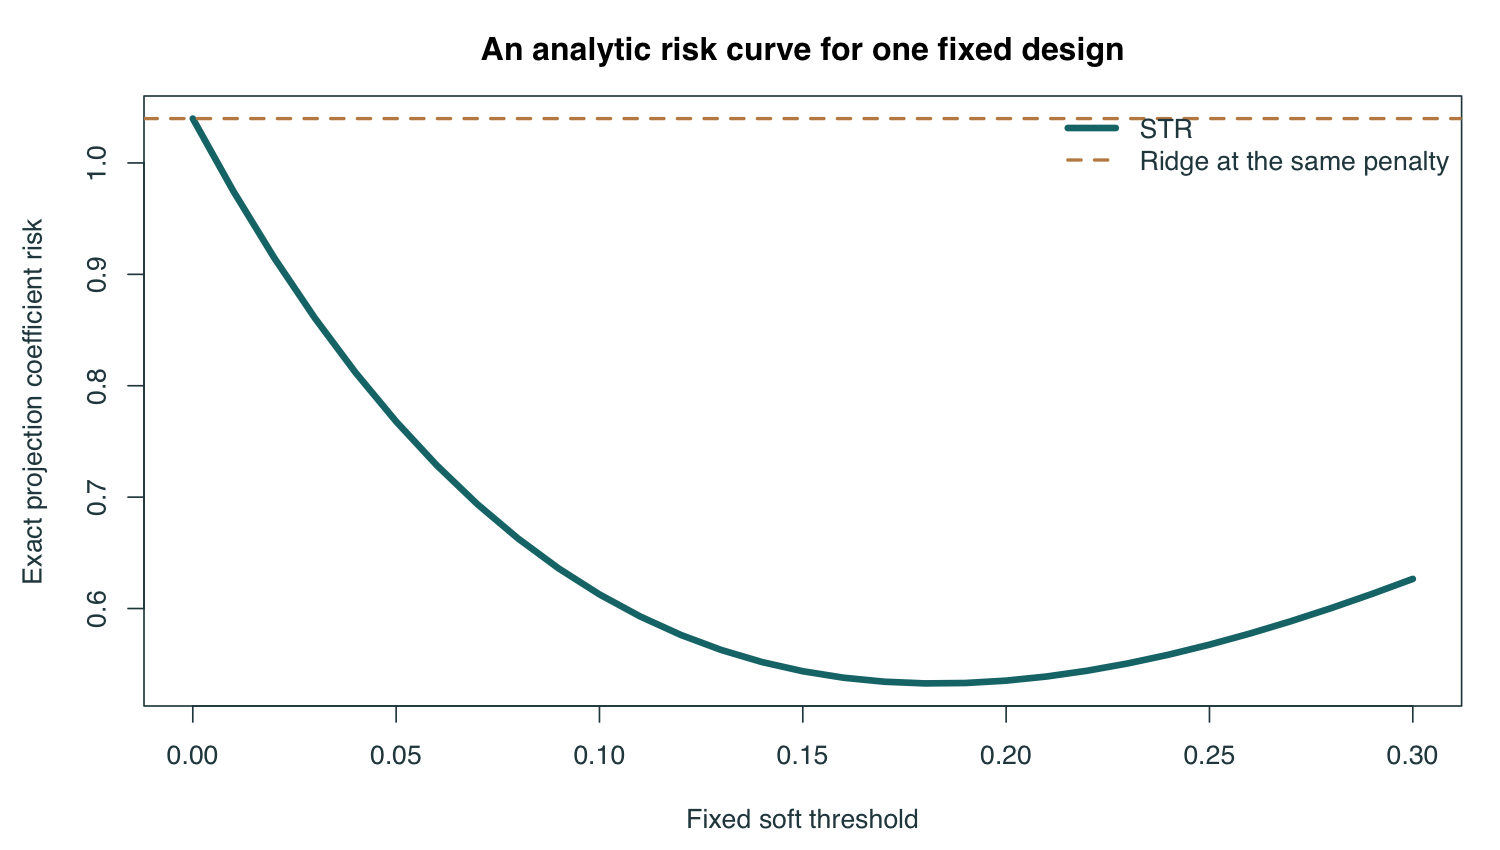
A fixed-design analytic illustration
For the 20-by-30 design above, seed 26, fixed penalty 2 and error
standard deviation 1, this curve evaluates the exact formula at 31 fixed
thresholds. It is an illustration for one specified target and design,
not an empirical performance study. Source:
tools/build-gallery.R.